by Chloé Fribourg,
Thomas Humbert, Juliette Jouve, Svenja Köhler, Kerkko Kivistö, Antti Alatalo
Our team is
composed of Chloé Fribourg (French exchange student), Thomas Humbert (French
exchange student), Juliette Jouve (French exchange student), Svenja Köhler
(German exchange student), Kerkko
Kivistö (finnish student) and Antti Alatalo (finnish student). A part of the
team already studied environmental engineering and have some experience about
the environmental issues and field. The other part of the team is studiing
mechanical and industrial engineering, however we would like to develop our
curiosity for the nature and the finnish environment through this course. For
the exchange students, we have the opportunity to explore the finnish
landscapes in order to link the environment with engineering by raising
awereness about pollution for example.
Task 1 : Survey of the watershed area and Observation of the environment
That’s why, on the 19th of September we have had our first course on field of Fieldworks of Environmental Technology. We discovered for the very first time the lake and the place we will study during this semester: the lake Pieni-Valkeinen. This one is located on the eastern slope of the Puijo ridge, in the residential neighborhood of Päiväranta.
This first
task consisted on doing a terrain survey of the Pieni-Valkeinen pond catchment
area.
First of all, we
noticed the conditions of weather on this day. The weather was sunny, without
any clouds and the temperature was around 11°C to 14°C.
We found
out the catchment area is composed of a mixed forest in the south of the lake
and a fir tree forest in the north of the lake. Apparently, there is no
agriculture in this place. Around the lake many houses have been built, some of
them appear to be built during the eighty’s, recognizable thanks to their
architecture. But some of the houses seem to be more recent and in building
progress, which means that human activity is increasing around the lake.

In fact,
many things can lead us to think that. There is a beach developed for the
inhabitants but also a car park. We found
some waste (like plastic bags) around the lake, some tractor prints on the
beach, but also a terrible oil puddle in the water near the beach.


Pictures 3 and 4- oil and tractor prints on the beach


Pictures 5 and 6- Beach and constructions for the beach
Besides
some manmade trails could be seen around the lake.

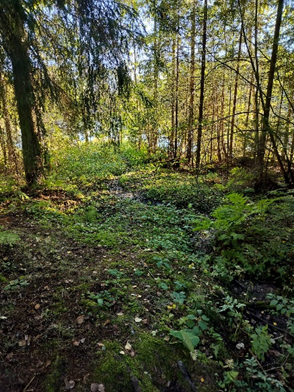
Picture
7- example of a manmade trail
All of those
things show that human activity is evolving in this place and has a huge impact
on nature in the catchment area. In fact, human activity is unfortunately synonym
with cars which implys pollution, that could impact so much the water quality.
We found
out this lake has many types of uses. First, it is a place where we can swim or
relax on the beach. Secondly, we saw also some people walking around with their
dogs or people that were biking around the forest. Finally, it could be a place for fishing but probably not the best one because of the size of the lake and of
human activity around.
A map of
the catchment area has been given to us and we tried to find out the
differences that could be observed between the map and the reality.

Picture
8- Map of the catchment area
We found
some differences in the input streams, on the map we can see just one input stream but we found 2 others. Those ones are smaller and currently drained. Moreover,
the recent building probably doesn’t appear on the map but this one is not
enough precise to be sure of that.
Input
streams:
We finally
found 3 input streams. The biggest one is the one that can be seen on the map.
The flow rate of this one is slow while the two other input streams, that
don't appear on the map, are dried up. However with the rain or maybe with
the melting snow (in November or December for example) they will be probably no
longer dry up.

Picture 9- The biggest input stream

Picture 10: A smaller input stream
Picture 11: A smaller input stream
Moreover, another source of water for the pond is of course the rain or the snow. There is also probably underground water sources that can’t be seen when we just look at the lake.
Output
stream:
We didn’t
find any other output stream except the one drawn on the map. This one is
pretty small compared to the size of the principal input streams and has also a
slow flow rate.

Picture 12- The output stream
Finally, we put some points on this map to show where are the input and output streams:

Picture 13- The location of input and output streams (input streams are on the left and output streams on the right )
To
conclude, the water of the lake could be better with less waste and less human
activity. But compared to some other lake this one could have a good quality of
water.
Task 3 : Discharge measurement using current meter
During this exercise the goal is to measure the
flow by doing some measurements in the main inlet and the outlet channels we
found before amid task 1. First of all, we had to understand the different measurement
tools, we had a meter and a tool that allows us to count the revolution per
time unit and so that the flow. Then, we went where we had to measure the flow
and we tried to find a spot in the inlet and the outlet channel where it’s deep
enough to measure the flow, and where there’s enough stream and not too small.
Measurement
outlet location: 62°55'43.5"N 27°39'46.4"E
Measurement
inlet location: 62°55'47.2"N 27°39'29.4"E

First, we
measured the dimensions of the area where we are going to measure our flow rate:
Outlet area:
52500mm²
Inlet area:
20000mm²

Figure 1 : Inlet stream representation

Figure 2 : Outlet stream representation

Measurement in the inlet channel
In both
streams, we have only one measurement, as the flow was “low” that day, partly
because of the weather conditions described in task 1 this day and the days
before. With these measurements, we calculate the velocity thanks to the
equation V=k*n+D where k is the hydraulic pitch of the propeller (m), D is the
characteristic of the current meter and n is the propeller revolution per
second.
And then we
calculate the discharge thanks to the equation below:
Q=V*A,
where V is the velocity, we calculated before and A is the area of the
subsection.
The measurement results are summarized in the table below:

To conclude
our experiment and our results, we found that it was a bit difficult to measure
the flow because of the small depts due to the weather conditions on this day. Besides
we have to notice that there are measurement uncertainties due to the equipment
used and that our measures depend on the weather and the conditions before of
course, that’s why we can have different values of the velocity and the
discharge each day.
However, we can remark that the outlet discharge is more important than the inlet one. We can conclude that we didn’t find all the incoming streams, for example there are underground incoming streams that we can’t measure with these tools, but which are important to consider.
The stream depths should be in mm not cm in the pictures.
VastaaPoista